This is the highest daily average on record at Mauna Loa, which is the more remarkable since the annual CO₂ maximum is typically reached in May, so even higher values are likely to be reached over the next few weeks.
The image below, adapted from NOAA, shows that the weekly mean CO₂ at Mauna Loa was 427.94 ppm for the week beginning on April 21, 2024, i.e. 3.98 ppm higher than the 423.96 ppm for the week 1 year earlier.

The image below, adapted from NOAA, shows that the daily mean CO₂ at Mauna Loa on April 26, 2024, was 428.59 ppm, a difference of 4.7 ppm from April 26, 2023.

The image below, adapted from NOAA, shows that the annual CO₂ growth at Mauna Loa in 2023 was 3.36 ppm, the highest annual growth on record.

The image below shows the daily average carbon dioxide recorded by NOAA over the past few years at Mauna Loa, Hawaii.

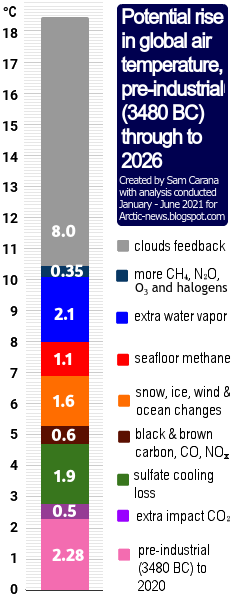
Clouds Tipping Point


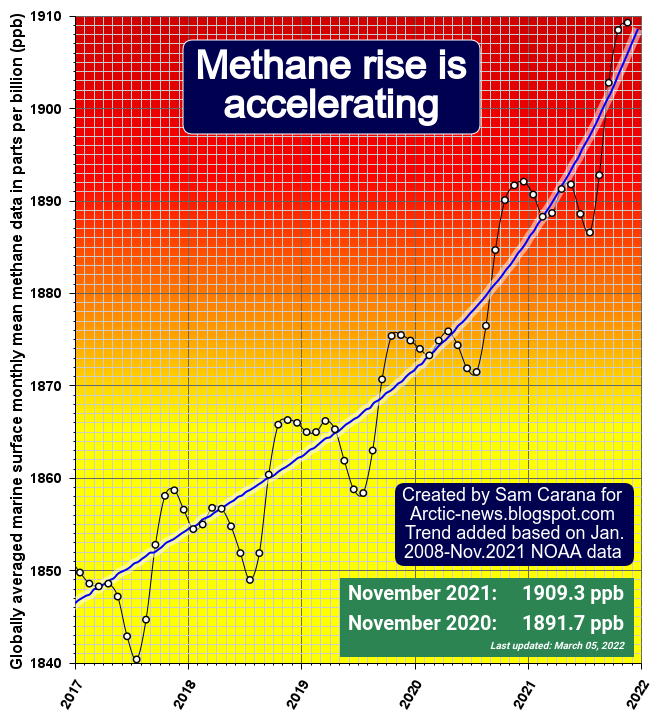
Moreover, the clouds tipping point could be crossed much earlier than 2060 when also taking into account methane. Monthly methane is approaching 2000 parts per billion (ppb) at Mauna Loa, Hawaii, as illustrated by the image below.

This 371.37 ppm CO₂e could be added almost immediately by a burst of seafloor methane less than the size of the methane that is currently in the atmosphere (about 5 Gt). There is plenty of potential for such an abrupt release, given the rising ocean heat and the vast amounts of methane present in vulnerable sediments at the seafloor of the Arctic Ocean, as discussed in earlier posts such as this one.
Already now, local peaks can at times reach very high levels. The image below shows that the NOAA-20 satellite recorded a peak level of 2432 ppb at 399.1 mb on April 25, 2024, am.

The MetOp-B satellite (also known as MetOp-1) recorded a peak methane level of 3644 ppb and a mean level of 1944 ppb at 367 mb on November 21, 2021, pm, as illustrated by the image below.
 |
| [ from earlier post ] |
 |
| [ from earlier post ] |
Could a combination of high CO₂ levels and high peak levels of methane suffice to cause the clouds tipping point to be crossed?
A 2018 study (by Strona & Bradshaw) indicates that most life on Earth will disappear with a 5°C rise. Humans, who depend for their survival on many other species, will likely go extinct with a 3°C rise, as illustrated by the image below, from an earlier post.

Environmental crimes
The accelerating growth in carbon dioxide indicates that politicians have failed and are failing to take adequate action.
Current laws punish people for the most trivial things, while leaving the largest crime one can imagine unpunished: planetary omnicide!
 |
| [ from earlier post ] |

If we accept that crimes against humanity include climate crimes, then politicians who inadequately act on the unfolding climate catastrophe are committing crimes against humanity and they should be brought before the International Criminal Court in The Hague, the Netherlands.
 |
| [ image from earlier post ] |
The situation is dire and the precautionary principle calls for rapid, comprehensive and effective action to reduce the damage and to improve the situation, as described in this 2022 post, where needed in combination with a Climate Emergency Declaration, as discussed at this group.

Links
https://gml.noaa.gov/dv/iadv/graph.php?code=MLO&program=ccgg&type=ts
• Scripps Institution of Oceanography
https://keelingcurve.ucsd.edu
• NOAA - Weekly average CO2 at Mauna Loa
https://gml.noaa.gov/ccgg/trends/weekly.html
• NOAA - annual mean carbon dioxide growth rates for Mauna Loa
https://gml.noaa.gov/ccgg/trends/gr.html
• Planetwide Ecocide - The Crime Against Life on Earth, by Andrew Glikson
https://arctic-news.blogspot.com/2021/12/planetwide-ecocide-the-crime-against-life-on-earth.html
https://arctic-news.blogspot.com/2019/04/how-long-do-we-have.html
https://arctic-news.blogspot.com/2020/02/arctic-ocean-february-2020.html
• Co-extinctions annihilate planetary life during extreme environmental change, by Giovanni Strona and Corey Bradshaw (2018)
https://www.nature.com/articles/s41598-018-35068-1
• The Clouds Feedback and the Clouds Tipping Point
https://arctic-news.blogspot.com/p/clouds-feedback.html
• Feedbacks in the Arctic
https://arctic-news.blogspot.com/p/feedbacks.html
• Pre-industrial
https://arctic-news.blogspot.com/p/pre-industrial.html
• Extinction
https://arctic-news.blogspot.com/p/extinction.html
• CO2 rise is accelerating
• When Will We Die?
https://arctic-news.blogspot.com/2019/06/when-will-we-die.html
https://arctic-news.blogspot.com/p/climateplan.html
• Climate Emergency Declaration
https://arctic-news.blogspot.com/p/climate-emergency-declaration.html