The MADNESS of NUCLEAR and CLIMATE HORROR
by Andrew Glikson

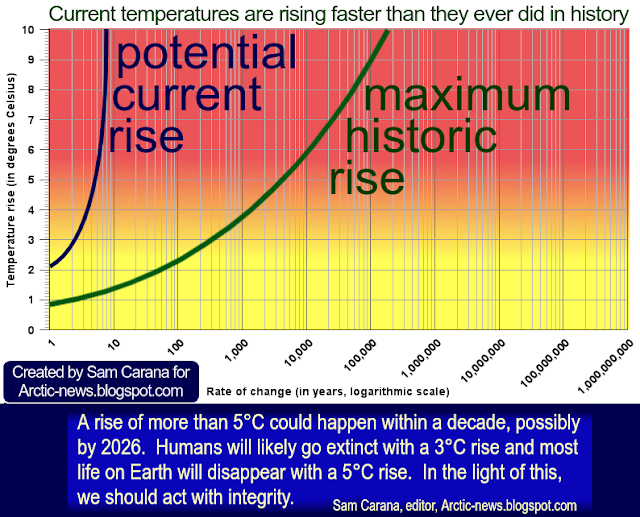
During the 20-21ˢᵗ centuries, as mean global temperature keeps rising toward 4°C, a failed brain neuron or a damaged computer chip can trigger a nuclear catastrophe, while the 24-hour media news cycle can blind humanity to the future. The conditions emerge where the world is largely taken over by the banality of evil, insane mass murders, fake news and artificial intelligence, lately camouflaged by glitzy Oscar-winning orgies attended by billionaires and celebrity actors, such as at the launch of the film Oppenheimer, where the 140 thousand incinerated victims and hibakusha survivors of the Hiroshima atomic bomb are completely ignored
The film, populated by nuclear scientists, decorated military officers and replete with romantic affairs, makes little reference to the looming road to a nuclear abyss herald by the clock of the atomic scientists. Thus “Oppenheimer does little to challenge the long history of glorifying the work of white men, and risks perpetuating the persistent, often reductive, portrayals of Japanese victims in Hiroshima and Nagasaki.”
The world arsenal of 12,500 nuclear warheads, enough to terminate many advanced species on Earth, is hardly mentioned in the film, dominated by the world of good vs evil proclaimed by priests of god’s chosen nations, while the doomsday machine on which civilization spends $trillions out of the mouth of starving children.
It is a statistical impossibility that this arsenal may not be triggered, at least in part, by accident or design, such as has nearly-happened. The bloodsheds in Ukraine herald the onset of a rules-free world where anything is allowable, ultimately toward global death in the name of freedom.
Perched in front of fluorescent screens, oblivious to the unthinkable, the collective is mesmerized by the obscene untruths of the global media, portraying tribal massacres alternating with funeral insurance advertisements, national hubris and vacuous amusement.
How long would it take, if ever, for people to learn that the last thing politicians would tell them is the entire truth, even if they are aware of it.
Sane voices such as of Noam Chomsky and John Pilger are no longer heard.
It is not clear to what extent it worries too many people that the oncoming climate catastrophe and mass extinction of species have become statistically inevitable, as the idea that near -200,000 years of evolution may be eliminated belongs to the unthinkable. The idea may hardly enter into the minds of most decision makers, politicians and strategists.
The 24-hour media news cycle renders peoples’ minds oblivious to the future, whether of their offspring or of the natural world itself.
The biggest lie, conscious or unconscious, used by authorities which are supposed to protect life, is when they use the term “Future” as they repeatedly do, the very future they are betraying by what they are doing and by what they currently are not.
A/Prof. Andrew Y Glikson
Earth and climate scientist
Books:
The Asteroid Impact Connection of Planetary Evolution
https://www.springer.com/gp/book/9789400763272
The Archaean: Geological and Geochemical Windows into the Early Earth
https://www.springer.com/gp/book/9783319079073
The Plutocene: Blueprints for a Post-Anthropocene Greenhouse Earth
https://www.springer.com/gp/book/9783319572369
The Event Horizon: Homo Prometheus and the Climate Catastrophe
https://www.springer.com/gp/book/9783030547332
Climate, Fire and Human Evolution: The Deep Time Dimensions of the Anthropocene
https://www.springer.com/gp/book/9783319225111
Evolution of the Atmosphere, Fire and the Anthropocene Climate Event Horizon
https://www.springer.com/gp/book/9789400773318
From Stars to Brains: Milestones in the Planetary Evolution of Life and Intelligence
https://www.springer.com/us/book/9783030106027
Asteroids Impacts, Crustal Evolution and Related Mineral Systems with Special Reference to Australia
https://www.springer.com/us/book/9783319745442
The Fatal Species: From Warlike Primates to Planetary Mass Extinction
https://www.springer.com/gp/book/9783030754679
The Trials of Gaia. Milestones in the evolution of Earth with reference to the Antropocene
https://www.amazon.com.au/Trials-Gaia-Milestones-Evolution-Anthropocene/dp/3031237080
The film, populated by nuclear scientists, decorated military officers and replete with romantic affairs, makes little reference to the looming road to a nuclear abyss herald by the clock of the atomic scientists. Thus “Oppenheimer does little to challenge the long history of glorifying the work of white men, and risks perpetuating the persistent, often reductive, portrayals of Japanese victims in Hiroshima and Nagasaki.”
The world arsenal of 12,500 nuclear warheads, enough to terminate many advanced species on Earth, is hardly mentioned in the film, dominated by the world of good vs evil proclaimed by priests of god’s chosen nations, while the doomsday machine on which civilization spends $trillions out of the mouth of starving children.
It is a statistical impossibility that this arsenal may not be triggered, at least in part, by accident or design, such as has nearly-happened. The bloodsheds in Ukraine herald the onset of a rules-free world where anything is allowable, ultimately toward global death in the name of freedom.
Perched in front of fluorescent screens, oblivious to the unthinkable, the collective is mesmerized by the obscene untruths of the global media, portraying tribal massacres alternating with funeral insurance advertisements, national hubris and vacuous amusement.
How long would it take, if ever, for people to learn that the last thing politicians would tell them is the entire truth, even if they are aware of it.
Sane voices such as of Noam Chomsky and John Pilger are no longer heard.
It is not clear to what extent it worries too many people that the oncoming climate catastrophe and mass extinction of species have become statistically inevitable, as the idea that near -200,000 years of evolution may be eliminated belongs to the unthinkable. The idea may hardly enter into the minds of most decision makers, politicians and strategists.
The 24-hour media news cycle renders peoples’ minds oblivious to the future, whether of their offspring or of the natural world itself.
The biggest lie, conscious or unconscious, used by authorities which are supposed to protect life, is when they use the term “Future” as they repeatedly do, the very future they are betraying by what they are doing and by what they currently are not.
A/Prof. Andrew Y Glikson
Earth and climate scientist
 |
| Andrew Glikson |
The Asteroid Impact Connection of Planetary Evolution
https://www.springer.com/gp/book/9789400763272
The Archaean: Geological and Geochemical Windows into the Early Earth
https://www.springer.com/gp/book/9783319079073
The Plutocene: Blueprints for a Post-Anthropocene Greenhouse Earth
https://www.springer.com/gp/book/9783319572369
The Event Horizon: Homo Prometheus and the Climate Catastrophe
https://www.springer.com/gp/book/9783030547332
Climate, Fire and Human Evolution: The Deep Time Dimensions of the Anthropocene
https://www.springer.com/gp/book/9783319225111
Evolution of the Atmosphere, Fire and the Anthropocene Climate Event Horizon
https://www.springer.com/gp/book/9789400773318
From Stars to Brains: Milestones in the Planetary Evolution of Life and Intelligence
https://www.springer.com/us/book/9783030106027
Asteroids Impacts, Crustal Evolution and Related Mineral Systems with Special Reference to Australia
https://www.springer.com/us/book/9783319745442
The Fatal Species: From Warlike Primates to Planetary Mass Extinction
https://www.springer.com/gp/book/9783030754679
The Trials of Gaia. Milestones in the evolution of Earth with reference to the Antropocene
https://www.amazon.com.au/Trials-Gaia-Milestones-Evolution-Anthropocene/dp/3031237080