Showing posts with label collapse. Show all posts

Sunday, August 6, 2023

Betrayal: The threat to life on Earth

by Andrew Glikson

It has been overlooked during Garma festival that, under current policies, global warming would render aboriginal lands in central and northern Australia unliveable and the top-end a nuclear target…

In his classic book The Fate of the Earth speaking for humanity Jonathan Schell describes the horror of a full-scale nuclear holocaust where human beings and animals would die if twenty thousand megatons of bombs, more than a million times the Hiroshima bomb, explode.

The consequences of a global nuclear exchange belong to the unthinkable. Nuclear weapons are the most destructive, inhumane and indiscriminate weapons ever created. Both on the scale of the devastation they cause and uniquely persistent genetically damaging radioactive fallout, they are unlike any other weapons. A single nuclear bomb detonated over a large city could kill millions of people. The use of tens or hundreds of nuclear bombs would disrupt the atmosphere world-wide, causing widespread famine.

[ Figure 1. Extreme geophysical, meteorological, hydrological and climatological events during 1980 -2012 ]

From the 1970s the full implications of climate change were only beginning to be realized, through a growing string of cyclones, fires, droughts and floods increasing in frequency and intensity above the recent historical record (Figure 1). At that time few could forecast the climate trajectory like NASA’s chief climate scientist (Hansen et al., 2012), who stated:

“Burning all the fossil fuels would create a different planet than the one that humanity knows. The paleoclimate record and ongoing climate change make it clear that the climate system would be pushed beyond tipping points, setting in motion irreversible changes, including ice sheet disintegration with a continually adjusting shoreline, extermination of a substantial fraction of species on the planet, and increasingly devastating regional climate extremes” and “warming according to the IPCC Business As Usual’ (BAU) scenario would lead to a disastrous multi-meter sea level rise on the century timescale” and “We’ve reached a point where we have a crisis, an emergency, but people don’t know that” ...

[ Figure 2. credit: NOAA, click on images to enlarge ]

According to Hans Joachim Schellnhuber, Germany’s chief climate scientist “Climate change is now reaching the end-game, where very soon humanity must choose between taking unprecedented action or accepting that it has been left too late and bear the consequences” …


Within a century or less the Earth’s mean temperature has risen from the mean levels of the Holocene (the last 11,700 years) and the Pleistocene (11,700 years ago to 2.58 million years ago), to levels of the Pliocene (2.58 million years ago to 5.333 million years ago) to the Miocene (5.33 to 23.03 million years ago), 3 - 4°C warmer than the Holocene, at warming rates. This is faster than any identified in the Cenozoic (66 million years until the present) geological record (Glikson, 2022-23). It is difficult to find in the geological record an event increasing the global greenhouse level at a rate as extreme as the current global heating (Figure 4).
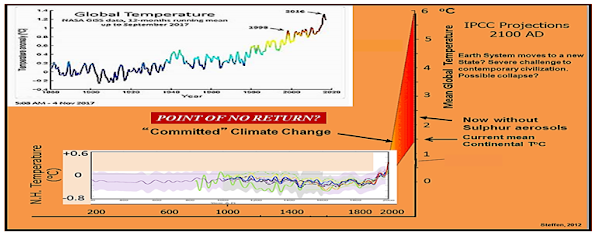
[ Figure 4. Past mean temperatures (200 AD to 2000 AD), current warming and future temperature projections (Steffen, 2012) ]

A nuclear war would represent the ultimate outcome of tribalism, nationalism, racism and war, the human propensity for mutual and self-destruction. There was a time when kings and generals would fall on their sword when they were defeated, or when their faith in their gods collapsed. Nowadays oblivious or non-caring world powers continue to proliferate nuclear weapons on hair trigger alert, mine coal and pump oil and gas, starting a greenhouse chain reaction. Leaders, so-called, opportunistically betray the defence of their own people and the future of their children. The voices of anti-nuclear and climate scientists have become subdued, ignored or betrayed. There may not be too many historians to document the 20-21ˢᵗ centuries crimes against humanity and against nature.

An explanation of the collapse of human society, dragging multiple species down with it, arises from Fermi’s Paradox, where the combination of technological achievements and an inherent killer instinct of some leads to collapse.


Andrew Glikson
A/Prof. Andrew Y Glikson
Earth and Paleo-climate scientist

Books:
The Asteroid Impact Connection of Planetary Evolution
https://www.springer.com/gp/book/9789400763272
The Archaean: Geological and Geochemical Windows into the Early Earth
https://www.springer.com/gp/book/9783319079073
The Plutocene: Blueprints for a Post-Anthropocene Greenhouse Earth
https://www.springer.com/gp/book/9783319572369
The Event Horizon: Homo Prometheus and the Climate Catastrophe
https://www.springer.com/gp/book/9783030547332
Climate, Fire and Human Evolution: The Deep Time Dimensions of the Anthropocene
https://www.springer.com/gp/book/9783319225111
Evolution of the Atmosphere, Fire and the Anthropocene Climate Event Horizon
https://www.springer.com/gp/book/9789400773318
From Stars to Brains: Milestones in the Planetary Evolution of Life and Intelligence
https://www.springer.com/us/book/9783030106027
Asteroids Impacts, Crustal Evolution and Related Mineral Systems with Special Reference to Australia
https://www.springer.com/us/book/9783319745442
The Fatal Species: From Warlike Primates to Planetary Mass Extinction
https://www.springer.com/gp/book/9783030754679
The Trials of Gaia. Milestones in the evolution of Earth with reference to the Antropocene
https://www.amazon.com.au/Trials-Gaia-Milestones-Evolution-Anthropocene/dp/3031237080


Friday, November 16, 2018

As El Niño sets in, will global biodiversity collapse in 2019?

Global biodiversity collapse
[ Will global biodiversity collapse in 2019? ]

recent study created a dataset of plant temperature tolerances with a median upper tolerance limit of 23.7°C.

This temperature is about 10°C higher than the temperature in the year 1750.
Only during times of mass extinctions were temperatures that high, such as during the PETM, 55.5 million years ago, and the Permian–Triassic extinction event, 252 million years ago, also know as the Great Dying when some 95% of species known from fossils went extinct.

[ image from: How much warmer is it now? ]
The study concludes that extinction will already occur far earlier than when upper tolerance levels are reached, as "loss of one species can make more species disappear (a process known as ‘co-extinction’), and possibly bring entire systems to an unexpected, sudden regime shift, or even total collapse."

There was a small group of species with large tolerance limits and remarkable resistance to environmental change, but even they could not survive co-extinctions. In fact, their extinction was abrupt and happened far from their tolerance limits and close to global biodiversity collapse at around 5°C of heating.

[ El Niño sets in ]
In the top image on the right, monthly NASA Land+Ocean temperature data 2017-October 2018 are adjusted, and a polynomial trend is added, showing how a 5°C rise in temperature could occur very rapidly, i.e. by September 2019.

The second image on the right is from an earlier post that contains more background on the adjustment of NASA data and the need for a polynomial trend.

A strong abrupt rise in temperature could be caused by an influx of warm salty water into the Arctic Ocean, as this can trigger large eruptions of methane from its seafloor, as discussed in earlier posts such as this one and as further discussed below.

As El Niño sets in, the odds that such rapid warming will threaten to cause global biodiversity collapse are rising.

Earthquakes triggering methane releases


An additional danger is that large methane releases from the seafloor of the Arctic Ocean will be triggered by earthquakes.

The danger is that isostatic rebound will trigger earthquakes in the Arctic Ocean that this in turn will destabilize methane hydrates, as discussed in more detail at this page.

Seismic shocks can travel over long distances along fault lines and destabilize methane hydrates in other locations.

Above image shows that on November 9, 2018, an earthquake with a magnitude of 6.8 on the Richter scale occurred on the fault line between Greenland and Norway.

This area is not used to be hit by large earthquakes. No larger earthquake has occurred in this area for more than 100 years.

Subsequent earthquakes did occur nearby, on November 12, 13 and 15, respectively measuring M4.3, M4.6 and M5.2 on the Richter scale, which also are very large earthquakes to hit this area.

Ominously, high levels of methane showed up on November 21, 2018, over the Greenland Sea (top image on the right).

Earlier, high levels of methane had been recorded over the Arctic Ocean. Note that this fault line runs across the Arctic Ocean toward the Laptev Sea.

Methane levels as high as 2787 ppb were recorded on November 15, 2018 (second image on the right).

On November 17, 2018, methane levels as high as 2847 ppb were recorded (third image on the right).

On November 20, 2018, methane levels as high as 2827 ppb were recorded (fourth image on the right).

The images show large methane levels over the East Siberian Arctic Shelf, the submarine permafrost north of Eastern Siberia.

In a 2008 paper, Dr. Natalia Shakhova et al. concluded that release of up to 50 Gt of methane from hydrates storage could occur at any time, an amount many times the methane that is now present in the atmosphere.

Additional emissions

Such a temperature rise would trigger many forest fires, releasing huge amounts of additional emissions, including carbon dioxide, methane and black carbon.

The image on the right shows carbon dioxide levels in California as high as 809 ppm on November 10, 2018 (at the green circle).

The next image on the right illustrates the jump in carbon dioxide levels in Mauna Loa, Hawaii, following the the fires in California.

“Levels of heat-trapping greenhouse gases in the atmosphere have reached another new record high,” the World Meteorological Organization (WMO) said in a recent news release. “There is no sign of a reversal in this trend, which is driving long-term climate change, sea level rise, ocean acidification and more extreme weather.”

“The science is clear. Without rapid cuts in CO₂ and other greenhouse gases, climate change will have increasingly destructive and irreversible impacts on life on Earth. The window of opportunity for action is almost closed,” said WMO Secretary-General Petteri Taalas.

“The last time the Earth experienced a comparable concentration of CO₂ was 3-5 million years ago, when the temperature was 2-3°C warmer and sea level was 10-20 meters higher than now,” said Mr Taalas.

“CO₂ remains in the atmosphere for hundreds of years and in the oceans for even longer. There is currently no magic wand to remove all the excess CO₂ from the atmosphere,” said WMO Deputy Secretary-General Elena Manaenkova.

In the associated video, Dr Oksana Tarasova added that “changes in carbon dioxide levels that we are observing now do not happen naturally. Such changes never ever happened in the history of this Planet.”

As the image on the right shows, CH₄, CO₂ and N₂O levels in the atmosphere are, respectively, 257%, 146% and 122% their 1750 levels.

How fast could 5°C warming happen? 

The U.S. Global Change Research Program has just released its Fourth National Climate Assessment. One of its key messages is that temperatures could rise by 5°C or more. The report adds that this could occur by the end of the century, but the report doesn't deny this could also occur much earlier. Indeed, one of its key findings is that some feedbacks and potential state shifts cannot be quantified; and some are probably still unknown.

What the report doesn't mention is that global biodiversity will have collapsed at 5°C of warming. Such a rise kills all plants on land and thus virtually all mammals (including humans), since they either directly or indirectly feed on plants.

A rapid 5°C rise could occur if an influx of warm salty water triggered methane eruptions from the seafloor of the Arctic Ocean. Combined with snow and ice loss, it could rapidly raise temperatures by 1.5°C, which increases water vapor. If cloud feedback is strongly positive, water vapor feedback can lead to 3.5 times as much warming, so these warming elements alone could cause 5°C warming within years. And then, of course, there are further warming elements.


The situation is dire and calls for comprehensive and effective action, as described at the Climate Plan, i.e. multiple lines of action implemented in parallel and locally where possible. Of course, as long as politicians remain reluctant to even consider pursuing efforts to reduce emissions, the world can be expected to remain in the Danger Zone for a long time to come.


Links

• Co-extinctions annihilate planetary life during extreme environmental change, by Giovanni Strona and Corey Bradshaw (2018)
https://www.nature.com/articles/s41598-018-35068-1

• Greenhouse gas levels in atmosphere reach new record, World Meteorological Organization (WMO)
https://public.wmo.int/en/media/press-release/greenhouse-gas-levels-atmosphere-reach-new-record

• WMO video - Press Conference: Greenhouse Gas Bulletin (Geneva, 22 November 2018)
http://webtv.un.org/watch/wmo-press-conference-greenhouse-gas-bulletin-geneva-22-november-2018/5970414543001/

• Fourth National Climate Assessment - U.S. Global Change Research Program
https://nca2018.globalchange.gov/

• Doomsday by 2021?
https://arctic-news.blogspot.com/2018/11/doomsday-by-2021.html

• Climate Plan
https://arctic-news.blogspot.com/p/climateplan.html

• Feedbacks
https://arctic-news.blogspot.com/p/feedbacks.html

• Extinction
https://arctic-news.blogspot.com/p/extinction.html

• Seismic Events
https://arctic-news.blogspot.com/p/seismic-events.html

• Can we weather the Danger Zone?
https://arctic-news.blogspot.com/2018/07/can-we-weather-the-danger-zone.html

• How much warmer is it now?
https://arctic-news.blogspot.com/2018/04/how-much-warmer-is-it-now.html

• What Does Runaway Warming Look Like?
https://arctic-news.blogspot.com/2018/10/what-does-runaway-warming-look-like.html

• Peaks Matter
https://arctic-news.blogspot.com/2018/08/peaks-matter.html

• Warning of mass extinction of species, including humans, within one decade
https://arctic-news.blogspot.com/2017/02/warning-of-mass-extinction-of-species-including-humans-within-one-decade.html


Friday, September 18, 2015

Arctic Sea Ice Collapse Threatens - Update 9

The image below shows that Arctic sea ice had reached a level of 4.45 million square kilometers on September 16, 2015 (end of dark blue line at center of image).


NSIDC has meanwhile called the 2015 minimum, but the first sentence of their post hastens to add that on September 11, Arctic sea ice reached its likely minimum for 2015,  at 4.41 million square kilometers (1.70 million square miles), putting 2015 in the fourth lowest place since satellite records began. Arctic sea ice minimum was lower only in 2012 (dotted line), 2007 (light blue line) and 2011 (orange line). Sea ice extent was 4.413 million square kilometers both on September 9, 2015, as well as on September 10 and 11, 2015.

September 9 would be early for the sea ice to reach its minimum, as a comparison with earlier years on above image illustrates. The dark blue line on above image shows that sea ice extent fell slightly on September 16, compared to the day before, and is now below the 2011 extent (orange line) for this time of the year. Over the next few days, sea ice extent may well fall somewhat further, and reach a level below the 2011 minimum, thus reaching the third lowest minimum extent since record began. This could eventuate due to winds compacting the sea ice.

More importantly, sea ice thickness is still falling, as illustrated by the image below showing the sea ice thickness on September 9 in the left panel and a forecast for thickness on September 24 in the right panel.


The image below compares sea ice thickness between September 24, 2012 (left panel) with that forecast for September 24, 2015 (right panel).


Above image illustrates why the situation in 2015 is even more threatening than it was in 2012. Only the ice that is colored light green, yellow and red is more than 3 meters thick. In 2015, ocean heat has been melting the sea ice from underneath. So, even while the currently lower temperatures of the air may have resulted in a slight increase in extent over the past week, the added ice is very thin. Ocean heat first of all goes into melting the thickest sea ice, i.e. the parts that are meters below the surface. This because the water at surface level is colder than the water underneath the surface. This explains why much of the water surface will remain covered by (very thin) ice as air temperatures are now falling (compared to air temperatures over the past few months).

The image below shows sea surface temperatures as at September 17, 2015.


In conclusion, while the sea ice appears to have survived the 2015 melting season without collapsing, the threat that this will occur in the coming years is ominous. Lack of multi-year sea ice makes that sea ice is in a very vulnerable situation. Total collapse of sea ice is therefore more likely to happen in the coming years. Every time ocean heat will arrive in the Arctic Ocean at its fullest strength in future, this heat will no longer be able to be fully absorbed by the process of melting thick sea ice, so what's left of the sea ice will melt very quickly.

There is a strengthening El Niño, while more open water increases the chance that storms will develop that will push the last remnants of the sea ice out of the Arctic Ocean, as discussed in earlier posts such as this one. Storms can also mix warm surface waters all the way down to the seafloor, as discussed in this earlier post. Cyclones that emerge with greater force due to high sea surface temperatures further increase this danger.

The big danger is that ocean heat will cause methane contained in sediments on the Arctic Ocean seafloor to be released abruptly in large quantities, triggering further methane releases spiraling into runaway warming.

The situation is dire and calls for comprehensive and effective action, as discussed in the Climate Plan.


Below is a text-only version of this post for radio.


Sea ice thickness on September 24, 2012 (left panel) compared to a forecast for September 24, 2015 (right panel). This...
Posted by Sam Carana on Friday, September 18, 2015

Friday, August 14, 2015

Arctic Sea Ice Collapse Threatens - Update 4


On August 12, 2015, Arctic sea ice extent was 6.043 million square km. For this date, the only years on record that sea ice extent was smaller were 2007, 2011 and 2012, as illustrated by above image.

Similarly, on August 11, 2015, Arctic sea ice area on August 11, 2015, was 3.67025 million square km (bottom end yellow line). For this date, the only years on record that sea ice area was smaller were 2007, 2011 and 2012.

So, will Arctic sea ice reach a record low this year? The situation is actually a lot worse than it appears when just looking at sea ice extent and area up until now. 

In fact, sea ice is in a horrible state. One indication of this is the almost complete absence of thick sea ice on August 12, 2015, which becomes even more clear when compared with the situation in 2012 for the same date, as illustrated by the image below. 

The absence of thick sea ice means that, in terms of volume, there is very little sea ice left to melt until the minimum volume will be reached around half September. In other words, the remaining sea ice could melt rather quickly. 


Also note the presence of water on the image below, from Web Cam 1, from the North Pole Environmental Observatory, National Science Foundation. For a drift map of the buoys, also see this page.


The image below shows sea surface temperature anomalies in the Arctic on August 13, 2015.


As discussed earlier, Greenland's dramatic losses of ice mass over the past few years and the subsequent large volumes of meltwater have affected sea surface temperatures in the North Atlantic and have caused the sea ice to be larger than it would otherwise have been in terms of extent and area.

Nonetheless, this has not halted the overall rise of ocean heat and the subsequent decline of Arctic sea ice, as illustrated by the discussion further above on sea ice thickness. Thick sea ice is shattered if not absent altogether in many places. 

Until now, the thicker multi-year sea ice used to survive the melting season, giving the sea ice strength for the next year, by acting as a buffer to absorb heat that would otherwise melt away the thinner ice. Without multi-year sea ice, the Arctic will be in a bad shape in coming years. Absence of thick sea ice makes it more prone to collapse, and this raises the question whether a collapse could occur not merely some years from now, but even this year.

Meanwhile, ocean heat is at a record high and there's an El Nino that's still gaining strength. The image below illustrates that a huge amount of ocean heat has been piling up in the Atlantic Ocean, ready to be carried into the Arctic Ocean, while large amounts of heat are also entering the Arctic Ocean from the Pacific Ocean through  the Bering Strait.

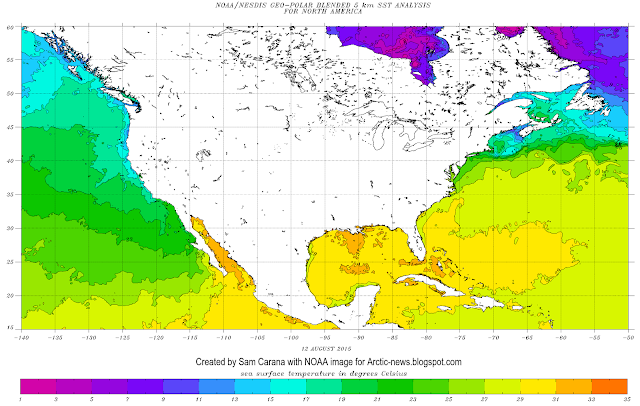
Sea surface temperatures around North America - note that the top end of the scale is 35°C or 95°F 

This ocean heat is likely to reach the Arctic Ocean in full strength by October 2015, at a time when sea ice may still be at its minimum. Absence of sea ice goes hand in hand with opportunities for storms to develop over the Arctic Ocean, which could mix surface heat all the way down to the seafloor, where methane could be contained in sediments. 

The methane situation is already very dangerous, given mean methane levels that recently reached levels as high as 1840 ppb, while much higher peak levels can occur locally, as illustrated by the image below. 
Methane levels appear to be rising by over 10 parts per billion a year at Barrow, Alaska. Worryingly, high peaks have been showing up there recently.

In conclusion, Arctic sea ice looks set to take a further battering over the next few weeks and could end up at a record low around half September 2015. If things get really bad, sea ice collapse could occur and the remaining pieces of sea ice could be driven out of the Arctic Ocean altogether by storms, resulting in a blue ocean event as early as September this year.

The situation is dire and calls for comprehensive and effective action, as discussed at the Climate Plan.


On August 11, 2015, Arctic sea ice area on August 11, 2015, was 3.67025 million square km (bottom end yellow line). For...
Posted by Sam Carana on Friday, August 14, 2015

Sunday, August 9, 2015

The Methane Monster


At no time in the past did humans exist under conditions that we are facing now, no matter how far back you go in history.

Global mean methane levels as high as 1840 parts per billion were recorded on August 4, 2015. This is the highest mean level since records began and this new record is likely to be superseded by even higher levels soon.

The carbon dioxide that is released now will only reach its peak impact a decade from now. Methane's high immediate impact makes it more important than carbon dioxide emissions in driving the rate of global warming over the coming decade.

The Pacific Ocean is very warm at the moment. Warm water flows from the Pacific Ocean through the Bering Strait into the Arctic Ocean. Sea surface temperatures in the Bering Strait were as high as 20.5°C (or 69.1°F) on August 4, 2015. That is 8.7°C (or 15.6°F) warmer than the water used to be. Sea surface temperatures as high as 11.8°C (53.2°F) were recorded in between Greenland and Svalbard on August 7, 2015, an anomaly of 8.5°C (15.3°F).

[ click on image to enlarge ]
The danger is that further warming will cause collapse of the sea ice, which in turn will lead to even more rapid warming of the Arctic Ocean, while the presence of more open water will also increase the opportunity for powerful storms to develop that can mix high sea surface temperatures all the way down to the seafloor, resulting in destabilization of sediments and triggering releases of methane that can be contained in such sediments in huge amounts.

Methane releases from the seafloor of the Arctic ocean threaten to cause rapid local warming that in turn will trigger further methane releases, in a vicious cycle of runway warming that could destroy habitat for humans within decades.

[ click on image to enlarge ]
The situation is dire and calls for comprehensive and effective action as discussed at the Climate Plan at the Arctic-News Blog.


References

-  Sea surface temperatures in the Bering Strait on August 4, 2015. 

- Sea surface temperatures in between Greenland and Svalbard on August 7, 2015.
http://earth.nullschool.net/#2015/08/07/0000Z/ocean/surface/currents/overlay=sea_surface_temp_anomaly/orthographic=18.75,79.02,3000

- Maximum warming occurs about one decade after a carbon dioxide emission, by Katharine L Ricke and Ken Caldeira (2014)
http://iopscience.iop.org/1748-9326/9/12/124002/article

- Methane's Global Warming Potential
http://arctic-news.blogspot.com/p/faq.html#13


THE METHANE MONSTER - by Sam Carana At no time in the past did humans exist under conditions that we are facing now,...
Posted by Sam Carana on Sunday, August 9, 2015

Monday, August 3, 2015

Arctic Sea Ice Collapse Threatens - Update 3

The image below is based on a nullschool.net forecast for August 6, 2015, run on August 2, 2015. It shows temperatures as high as 26.4°C (or 79.4°F) in the north of Canada (green circle). The inset, based on a Climate Reanalyzer forecast for that date, shows that this is as much as 20°C (or 36°F) higher than temperatures that were common in the area only recently, i.e. from 1979-2000.


The satellite image below, captured on August 2, 2015, shows a close-up of the area, with the green circle in the same location as on above image.


Above image shows that there still is some solid ice present to the right of the green circle. This ice may not be able to survive such high temperatures for long. Furthermore, above image shows what looks like smoke plumes from wildfires to the left of the green circle, another sign of the high temperatures in the area and another feedback that will accelerate decline of the snow and ice cover.

Disappearance of sea ice thicker than 4 meters is now taking place north of Canada and Greenland. It looks set to virtually disappear soon, as shown by the 30-day Naval Research Laboratory animation below, ending with a forecast up to August 10, 2015.


In my experience, sea ice thickness hasn't looked this bad for this time of the year since records began, especially when taking the loss of multi-year ice into account. Until now, the thicker multi-year sea ice used to survive the melting season, giving the sea ice strength for the next year, by acting as a buffer to absorb heat that would otherwise melt away the thinner ice. Without multi-year sea ice, the Arctic will be in a bad shape in coming years. Absence of thick sea ice makes it more prone to collapse, and this raises the question whether a collapse could occur not merely some years from now, but even this year.


Above image below shows sea surface temperature anomalies in the Arctic on August 2, 2015.

Greenland's dramatic loss of ice mass over the past few years and the subsequent meltwater may have caused the sea ice to be larger than it would otherwise have been.

Nonetheless, this has not halted the overall decline of the sea ice. As the image on the right shows, sea ice area now is about as low for the time of the year as it was for the three lowest years on record. Furthermore, thick sea ice is shattered if not gone altogether in many places. Meanwhile, ocean heat is at a record high and there's an El Nino that's still gaining strength.

In conclusion, Arctic sea ice looks set to take a further battering over the next few weeks and could end up at a record low around half September 2015. If things get really bad, sea ice collapse could occur and the remaining pieces of sea ice could be driven out of the Arctic Ocean altogether by storms, resulting in a blue ocean event as early as September this year.

The situation is dire and calls for comprehensive and effective action, as discussed at the Climate Plan.


Arctic sea ice area on July 31, 2015.
Posted by Sam Carana on Sunday, August 2, 2015

Friday, July 31, 2015

Arctic Sea Ice Collapse Threatens - Update 2

The image below shows sea surface temperature anomalies in the Arctic on July 30, 2015.


Due to warm ocean waters and to heatwaves on land that extended over the Arctic Ocean, while warming up rivers ending into the Arctic Ocean, the sea ice has taken a battering over the past few weeks, as illustrated by the images below.


Above image shows the last bit of thick (5 m) sea ice in the Canadian Archipelago, which became dislodged on July 8, 2015. It looks set to be virtually gone by August 7, 2015, according to the 30-day Naval Research Laboratory animation below, and as also discussed in greater detail in a recent post.


The situation at the north-eastern tip of Greenland doesn't look much better, as illustrated by the image below.


The comparison image below also shows the north-eastern tip of Greenland on July 5, 2015 (top), and on July 31, 2015 (bottom). The bottom image shows water in many places, pushing the last pieces of thick ice into the Wandel Sea and Fram Strait .

[ click on images to enlarge ]
Until now, the thicker multi-year sea ice used to survive the melting season, giving the sea ice strength for the next year, by acting as a buffer to absorb heat that would otherwise melt away the thinner ice. Without multi-year sea ice, the Arctic will be in a bad shape in coming years. 

[ click on images to enlarge ]
What caused the dramatic melting of this thick ice? The left panel of above image shows temperatures. On July 29, 2015, temperatures as high as 23.1°C (or 73,7°F) were recorded on the north coast of Victoria Island, in the Canadian Archipelago (green circle where the arrow points at). The satellite image on the right, captured that same day, shows that hardly any ice was left in the waters surrounding the area.


So, will the sea ice collapse this year? Consider the following four points:

Volume - The image on the top right shows sea ice volume as calculated by PIOMAS at the University of Washington. It shows that in June, volume was less than 2015 in only four years, i.e. 2010 through to 2013. The situation has deteriorated much in July 2015, and looks set to deteriorate even further.

Thickness - Volume is calculated by looking at both thickness and extent. Thickness is looking much worse than it did in the years 2012 through to 2014, as illustrated by above image.

In my experience, sea ice thickness hasn't looked this bad for this time of the year since records began, especially when taking the loss of multi-year ice into account, as also illustrated by the full-width above image.


Extent - Sea ice extent on July 31 was only outside the 2 standard deviations (shaded area) in the years 2007, 2011 and 2012, as illustrated by the image mid right. The dark blue line marks the 2015 extent, with the dot indicating extent on July 31, 2015.

Area - Similarly, Arctic sea ice area is illustrated by the image on the right. For a description of the difference between extent and area, view this NSIDC FAQ page. The bottom right image marks Arctic sea ice area as on July 30, 2015. The yellow marker indicates the situation for the year 2015 on this date. The only years with less sea ice area at this time of the year were 2007, 2011 and 2012.

Also consider that 2015 features very high sea surface temperatures and an El Niño that is still gaining in strength. Thick sea ice appears to be shattered, as illustrated by the satellite images. In conclusion, sea ice looks set to take a further battering over the next few weeks and could end
up at a record low thickness, extent, area and volume around half September 2015.

With that in mind, let's take a look at the image below.


Above image shows a trendline (shaded area) based on satellite data from 1979-2014, with annual minimum volume figures calculated by PIOMAS. The shaded area points at a total disappearance of the sea ice as early as September 2018. The width of the shaded area reflects natural variability, but natural variability could be wider than that, as illustrated by the fact that minimum volume in the years 2007, 2010, 2011 and 2012 was lower than the shaded area. In other words, disappearance of the sea ice could occur even earlier than September 2018 and if things get really bad, collapse could even occur as early as September this year.

The situation is dire and calls for comprehensive and effective action, as discussed at the Climate Plan.


Will the sea ice collapse this year? Firstly, consider that sea ice volume now hasn't been this bad for any day in July...
Posted by Sam Carana on Friday, July 31, 2015

Tuesday, July 21, 2015

Ocean Temperatures At Record High

Of all the excess heat that results from people's emissions, 93.4% goes into oceans. Accordingly, ocean heat has strongly increased over the years.

NOAA analysis shows that, for the oceans on the Northern Hemisphere, the June 2015 sea surface temperature was at a record high 0.87°C (1.57°F) above the 20th century average of 16.4°C (61.5°F), as also illustrated by the graph below.


The most recent 12-month period, July 2014–June 2015, also broke the record (set just last month) for the all-time warmest 12-month period in the 135-year period of record. 


As the above image shows, sea surface temperature anomalies around North America are very high, threatening to further raise temperatures of the Arctic Ocean, which already has very high sea surface temperatures, as also illustrated by the image below. 


As the image below shows, sea surface temperatures as high as 19°C (66.2°F) were recorded in the Bering Strait on July 19, 2015.


The snow depth comparison below shows the situation on July 20, 2015, on the left and a forecast for July 27, 2015, on the right. The green lines indicate areas where sea ice is at melting point. Note the decline of snow cover on Greenland and the Himalayas.


As the continued snow decline on Greenland also illustrates, high temperatures can be expected to keep causing further decline of the snow and ice cover for many weeks to come, given that the minimum sea ice extent is typically reached about half September.

As the image below shows, sea surface temperatures as high as 10.1°C (50.1°F) were recorded in Baffin Bay, off the west coast of Greenland, on July 20, 2015.


On July 21, 2015, temperatures as high as 14°C (57.1°F) were recorded east of Svalbard, an anomaly of 9.7°C (17.4°F), as illustrated by the image below, created with nullschool.net images.


The danger is that warm water will enter the Arctic Ocean and cause the Arctic sea ice to collapse, which could make the Arctic Ocean absorb even more heat. This could unleash huge methane eruptions from the Arctic Ocean's seafloor, in turn driving temperatures up even higher and causing more extreme weather events, wildfires, etc.

The situation is dire and calls for comprehensive and effective action, as discussed at the Climate Plan


For the oceans on the Northern Hemisphere, the June 2015 sea surface temperature was at a record high 0.87°C (1.57°F)...
Posted by Sam Carana on Tuesday, July 21, 2015