Globally, temperatures have been at record high levels for the time of year for some time in 2023, as illustrated by the image below, adapted from Climate Reanalyzer.
On August 25, 2023, the world temperature was 16.99°C, 0.94°C higher than it was on that day in 1979-2000.
Extreme heat stress alert
High Wet Bulb Globe Temperatures hit the U.S. over a large area, over a long time.
Wet Bulb Globe Temperatures were forecast to be as high as 95°F or 35°C in Lufkin, Texas, on Monday August 21, 2023 at 4 am Central Time.
Wet Bulb Globe Temperatures as high as 35°C were also forecast to be reached in Topeka, Kansas on the same day and at the same time, as illustrated by the image below.
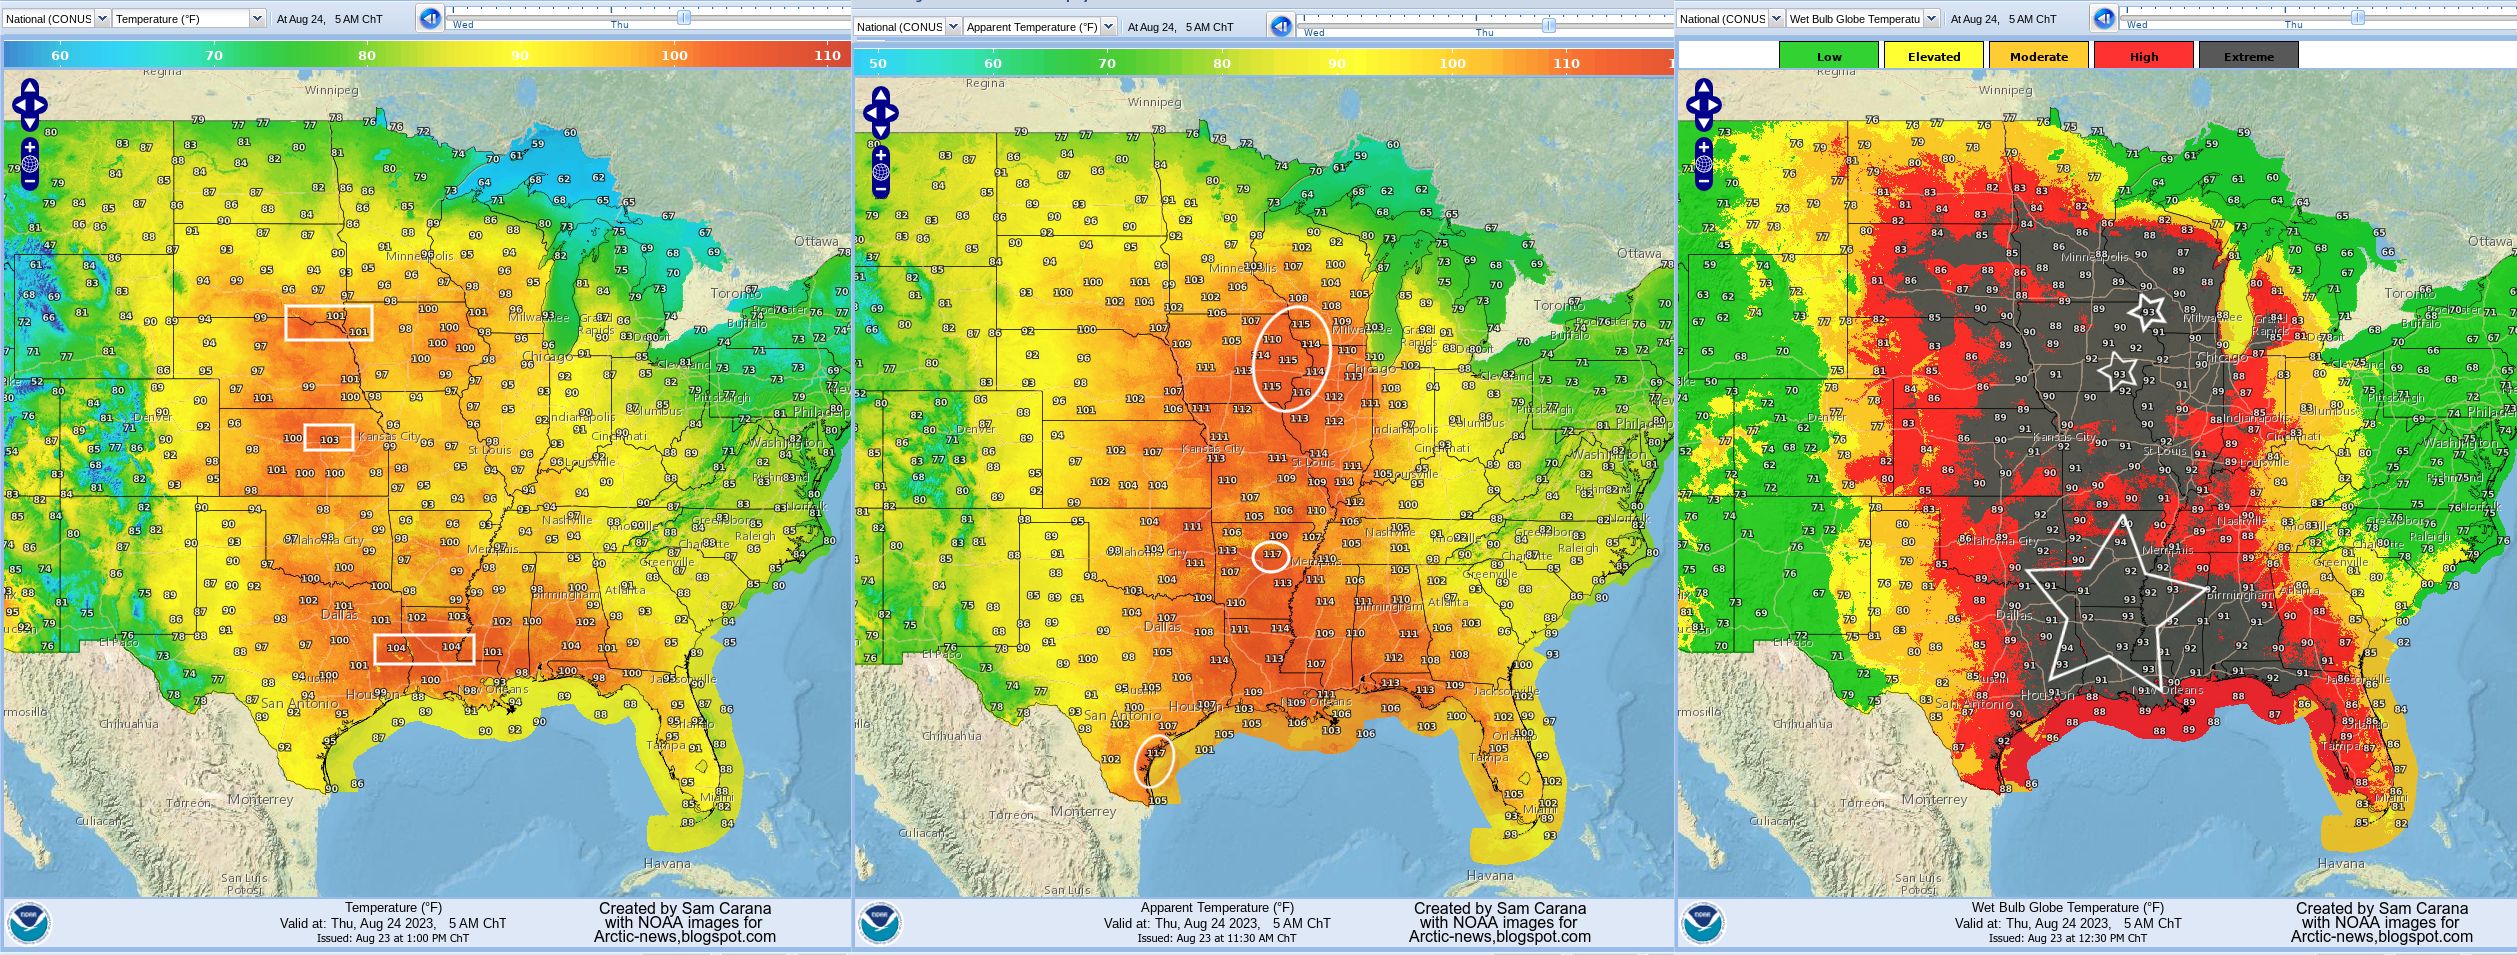
The image below shows forecasts for August 24, 2023, measured as temperature (left), apparent temperature (center) and wet bulb globe temperature (right), three areas with high values marked by squares, circles, and stars, respectively.
For descriptions of the various ways temperature can be measures, also see the earlier post Extreme Heat Stress.
Unbearable conditions
The images further illustrate that, as temperatures rise, conditions are increasingly occurring that make it hard, if not impossible for many species (including humans) to survive, even at relatively high latitudes. This danger has been discussed in many earlier posts, such as in Humans may be extinct in 2026 and Two Tipping Points.
In the video below, Guy McPherson gives his views on the situation.
The Blob is a large mass of water with relatively high heat content, floating at the surface and underneath the surface of the North Pacific Ocean. The Blob did appear several times before, including in 2016, which was a strong El Niño year. The above image shows high sea surface temperature anomalies in the North Pacific on August 10, 2023, raising the question of whether this constitutes a return of the Blob.
As temperatures rise, the Arctic is heating more rapidly than the rest of the world. The narrowing temperature difference between the Arctic and the Tropics is weakening the speed at which the jet stream circumnavigates Earth and this is making the jet stream more wavy.
In a 2012 study, Jennifer Francis et al. warned that this makes atmospheric blocking events in the Northern Hemisphere more likely, aggravating extreme weather events related to stagnant weather conditions, such as droughts, flooding and heatwaves. The Blob appears to be the marine version of a heatwave on land.
The image below shows that, on August 12, 2023, sea surface temperatures were as much as 7°C or 12.6°F higher than 1981-2011 in the Pacific Ocean (at the green circle, follow the arrow). A strongly deformed Jet Stream shows many circular wind patterns, prolonging, intensifying and increasing the occurrence of extreme weather events such as accumulation of heat during heatwaves.
Is the Kuroshio Current slowing down?
The Kuroshio Current is an ocean current that carries heat along its path in the North Pacific, similar to the Gulf Stream in the North Atlantic Ocean. Is the Kuroshio Current slowing down as temperatures rise and is such slowing down causing hot water to accumulate in the western part of the North Pacific, leading to a return of a new Blob moving across the North Pacific toward the coast of North America?
The North Atlantic has been experiencing record high sea surface temperatures recently. A return of the Blob increases the danger of more heat reaching sediments at the seafloor of the Arctic Ocean.
[ 2022 animation ]
The animation on the right shows how remnants of Typhoon Merbok were forecast to enter the Arctic Ocean through the Bering Strait from September 17 to 19, 2022.
Studies, some of them dating back more than two decades, show that over the shallow East Siberian Arctic Shelf (ESAS) winds at times can mix the water column from the top to the bottom. A 2005 study of the ESAS led by Igor Semiletov recorded water temperatures at the seafloor, in September 2000, of 4.7°C at 20m depth at one location and 2.11°C at 41m depth at another location, with salinity levels of 29.7‰ and of 31.7‰, respectively.
A deformed Jet Stream, in combination with a cyclone, could result in strong winds abruptly pushing a huge amount of heat through the Bering Strait into the Arctic Ocean. This could cause methane hydrates to destabilize and huge amounts of methane to erupt from the seafloor and enter the atmosphere.
High Wet Bulb Globe Temperatures (WBGT) are forecast to hit Louisiana, United States, over the next few days. The image below shows a forecast for August 2, 2023, 18 UTC, with WBGT as high as 35°C forecast for a location 10 miles South East of Abbeville, Louisiana, U.S.
WBGT is a measure used by weather.gov to warn about expected heat stress when in direct sunlight. It takes into account the effect of temperature, relative humidity, wind speed, and solar radiation on humans.
As temperatures and humidity levels keep rising, a tipping point can be reached where the wind factor no longer matters, in the sense that wind can no longer provide cooling. The human body can cool itself by sweating, which has a physiological limit that was long described as a 35°C wet-bulb temperature. Once the wet-bulb temperature reaches 35°C, one can no longer lose heat by perspiration, even in strong wind, but instead one will start gaining heat from the air beyond a wet-bulb temperature of 35°C.
Accordingly, a 35°C wet-bulb temperature (equal to 95°F at 100% humidity or 115°F at 50% humidity) was long seen as the theoretical limit, the maximum a human could endure.
A 2020 study (by Raymond et al.) warns that this limit could be regularly exceeded with a temperature rise of less than 2.5°C (compared to pre-industrial). A 2018 study (by Strona & Bradshaw) indicates that most life on Earth will disappear with a 5°C rise. Humans, who depend for their survival on many other species, will likely go extinct with a 3°C rise, as illustrated by the image below, from an earlier post.
A 2022 study (by Vecellio et al.) finds that the actual limit is lower — about 31°C wet-bulb or 87°F at 100% humidity — even for young, healthy subjects. The temperature for older populations, who are more vulnerable to heat, is likely even lower. In practice the limit will typically be lower and depending on circumstances could be as low as a wet-bulb temperature of 25°C.
The above image shows a Wet Bulb Globe Temperature of 35°C (95°F) forecast for August 11, 2023, 19 UTC, for a location near Baton Rouge, Louisiana, U.S.
Heat is the leading cause of weather-related deaths in the United States, as illustrated by the above image (credit: NOAA). Heat fatalities may be conservative figures. Recent research finds that where heat is being listed as an official cause of death, this likely underestimates the full toll of these events. Extreme heat can trigger heart attacks and strokes. In addition, some heart disease risk factors, such as diabetes—as well as heart medications, such as diuretics and beta blockers—can affect a person’s ability to regulate their body temperature and make it difficult to handle extreme heat. The study finds that extreme heat accounted for about 600-700 additional deaths from cardiovascular disease annually. A recent study estimates that extreme heat accounted for 12,000 premature deaths in the contiguous U.S. from 2000 to 2010, and a recent analysis calculates that the summer 2022 heatwave killed 61,000 people in Europe alone.
The image below shows a temperature (°F) forecast for August 1, 2023, from Climate Reanalyzer.
The image below show a high reading on the 'Misery Index', the perceived ('feels like') temperature that is used by nullschool.net, combining wind chill and the heat index (which in turn combines air temperature and relative humidity, in shaded areas). A Misery Index temperature of 56.1°C or 133.1°F was recorded at a location off the coast of the United Arab Emirates (green circle) on August 5, 2023.
The temperature at that location at the time was 35.2°C or 95.4°F, lower than the temperature on the land surrounding the Gulf, but the relative humidity at that spot over the water was 78%, and that combination led to this very high 'feels like' temperature.
This constitutes a warning. The sea, rivers and lakes are traditionally seen as places to go to, to cool off. However, high temperatures combined with high humidity over water bodies can result in conditions that go beyond what humans can bear.
Climate change danger assessment
The image below, earlier discussed here, expands risk assessment beyond its typical definition as the product of the severity of impact and probability of occurrence, by adding a third dimension: timescale, in particular imminence.
Imminence alone could make that the danger constituted by rising temperatures needs to be acted upon immediately, comprehensively and effectively. While questions may remain regarding probability, severity and timescale of the dangers associated with climate change, the precautionary principle should prevail and this should prompt for action, i.e. comprehensive and effective action to reduce damage and improve the situation is imperative and must be taken as soon as possible.
Rapidly rising temperatures constitute tipping points in several ways
Firstly, there is a biological threshold beyond which rising temperatures become lethal for humans, as discussed above.
Secondly, as Gerardo Ceballos describes in the video below and in a 2017 analysis, there is a biological tipping point that threatens annihilation of species via the ongoing sixth mass extinction. Researchers such as Gerardo Ceballos (2020), Kevin Burke (2018) and Ignation Quintero (2013) have for years warned that mammals and vertebrates cannot keep up with the rapid rise in temperature. Humans are classified as vertebrate mammals, indicating that we
will not avoid the fate of extinction, Guy McPherson (2020) adds.
Thirdly, there are further tipping points, e.g. social-political ones. On the one hand, it would be good if people became more aware, as this could prompt more people into supporting the necessary action. On the other hand, as temperatures keep rising, there is also a danger that panic will break out, dictators will grab power and civilization as we know it will collapse abruptly, as warned about earlier, e.g. in 2007.
• Biological annihilation via the ongoing sixth mass extinction signaled by vertebrate population losses and declines - by Gerardo Ceballos, Paul R. Ehrlich and Rodolfo Dirzo (2017) https://www.pnas.org/content/114/30/E6089
• Rates of projected climate change
dramatically exceed past rates of climatic niche evolution
among vertebrate species - by Ignatio Quintero et al. (2013)
High Wet Bulb Globe Temperature (WBGT) is forecast to hit the Southeastern United States over the next few days. The image below shows a forecast for June 29, 2023, 18 UTC with WBGT as high as 34°C (93°F) forecast for a location near Jackson, Mississippi, U.S.
[ click on images to enlarge ]
WBGT is a measure used by weather.gov to warn about expected heat stress when in direct sunlight. It estimates the effect of temperature, relative humidity, wind speed, and solar radiation on humans using a combination of temperatures from three thermometers:
A Wet bulb measures the temperature read by a thermometer covered in a wet cloth. As water evaporates from the cloth, evaporation cools the thermometer. This mirrors how the human body cools itself with sweat.
A black globe is used to measure solar radiation. Solar radiation heats the globe and wind blowing across it cools the globe.
A Dry bulb calculates the air temperature measured in the shade. It is the temperature you would see on your thermometer outside.
The images on the right earlier featured in a 2016 post.
The top image, an animation from the EPA, illustrates that a relatively small rise in average temperature can have a huge impact and result in a lot more hot weather as well as in even more extreme hot weather.
The three images underneath, from the IPCC, show the effect on extreme temperatures when (a) the mean temperature increases, (b) the variance increases, and (c) when both the mean and variance increase for a normal distribution of temperature.
The thermodynamic wet-bulb temperature is determined by temperature, humidity and pressure (hPa), and it is the lowest temperature that can be achieved by evaporative cooling of a water-wetted ventilated surface.
As temperatures and humidity levels keep rising, there comes a point where the wind factor no longer matters, in the sense that wind can no longer provide cooling.
The human body can cool itself by sweating, which has a physiological limit that was long described as a 35°C wet-bulb temperature. Once the wet-bulb temperature reaches 35°C, one can no longer lose heat by perspiration, even in strong wind, but instead one will start gaining heat from the air beyond a wet-bulb temperature of 35°C.
Accordingly, a 35°C wet-bulb temperature (equal to 95°F at 100% humidity or 115°F at 50% humidity) was long seen as the theoretical limit, the maximum a human could endure.
A 2020 study (by Raymond et al.) warns that this limit could be regularly exceeded with a temperature rise of less than 2.5°C (compared to pre-industrial). A 2018 study (by Strona & Bradshaw) indicates that most life on Earth will disappear with a 5°C rise. Humans, who depend for their survival on many other species, will likely go extinct with a 3°C rise, as illustrated by the image below, from an earlier post.
A 2022 study (by Vecellio et al.) finds that the actual limit is lower — about 31°C wet-bulb or 87°F at 100% humidity — even for young, healthy subjects. The temperature for older populations, who are more vulnerable to heat, is likely even lower. In practice the limit will typically be lower and depending on circumstances could be as low as a wet-bulb temperature of 25°C.
The images below show high readings on the 'Misery Index', the perceived temperature that is used by nullschool.net, combining wind chill and the heat index (which in turn combines air temperature and relative humidity, in shaded areas).
The image below shows a forecast for June 29, 2023 20 UTC, with weather conditions prolonged by circular wind patterns at 250 hPa (Jet Stream), while the Jet Stream is crossing the Equator (bottom left). Temperatures as high as 39.9°C (103.7°F) combined with a relative humidity of 35% result in perceived temperatures as high as 45°C (112.9°F) at the green circle.
As it turned out, the perceived temperature was as high as 44.9°C or 112.7°F on June 29, 2023 19 UTC, due to a 39.1°C or 102.5°F temperature and a 38% relative humidity at the surface, and with conditions prolonged by a distorted Jet Stream (at 250 hPa), with circular wind patterns and winds crossing the Equator.
The image below shows high readings on the 'Misery Index' for parts of Pakistan. On June 22, 2023, an air temperature of 45.4°C (113.7°F) and a relative humidity of 25% resulted in a perceived temperature of 51°C (123.7°F) at the area marked by the green circle.
The above image also shows the Jet Stream (wind at 250 hPa). Distortion of the Jet Stream can lead to circular wind patterns that amplify heatwaves. As temperature rise, the temperature difference between the Equator and the Arctic narrows, distorting the Jet Stream resulting in more extreme weather.
Perceived (feels like) air temperatures as high as 53.1°C or 127.7°F were recorded in Pakistan on July 4, 2023, 09 UTC (at green circle), with a 46.7°C or 116.1°F temperature and a 24% relative humidity recorded at the surface. Also, Jet Stream deformation shows up (at 250 hPa), with circular wind patterns and wind crossing the Equator (at the image bottom).
Meanwhile, heatwave conditions have also been affecting China, Texas and Mexico recently, with all-time high temperature records broken in each of these places.
The press release of a 2022 Unicef report has the title 559 million children currently exposed to high heatwave frequency, rising to all 2.02 billion children globally by 2050.
Fire and smoke from fires
An additional hazard is fire and the smoke from fires. The image below shows biomass-burning aerosols from fires in Canada extending over the North Atlantic on June 25, 2023, 03 UTC.
The forecast for June 29, 2023 21 UTC below shows remnants of the Canadian forest fires reaching Western Europe.
Feedbacks
As temperatures rise, fire and smoke hazards increase due to self-reinforcing feedback loops, including:
Albedo loss and Jet Stream distortion: - as sea ice melts away and gets covered by meltpools and rainwater pools, soot, dust, and algae, the resulting albedo loss further pushes up temperatures - the narrowing temperature difference between the Arctic and the Tropics causes Jet Stream distortion, resulting in more extreme weather, incl. stronger storms that come with more lightning and can carry more oxygen to fires and spread fires faster and wider, and more intense heatwaves that can dramatically push up local temperatures, further intensifying droughts and forest fires
a further self-reinforcing feedback loop is that water that was previously present in the soil, is increasingly moving up into the atmosphere, as the atmosphere sucks up more water vapor (7% more water vapor for every 1°C in temperature rise ), resulting in: - less evapotranspiration from vegetation, in turn resulting in less clouds and rain, thus pushing up temperatures and drying out soil and vegetation even more - erosion and less healthy vegetation that is more vulnerable to pests and diseases such as bark beetles, resulting in an increase in dead trees providing more fuel for fires
The image on the right, from a news release associated with a 2022 study, shows changes in atmospheric thirst, measured in terms of reference evapotranspiration from 1980-202 (in mm).
As temperatures rise due to people's emissions, more evaporation will take place over both land and oceans, but not all water will return as precipitation, so more water vapor will stay in the air and droughts affecting the soil and vegetation will intensify.
Water in the soil acts as a buffer, slowing down the temperature rise, so drier soil will heat up faster and further, causing land surface temperatures to rise even more and amplifying the impact of Urban heat island and Heat dome phenomena.
The image on the right, adapted from ESA, shows land surface temperatures as high as 65°C (149°F) in India on April 26, 2022. Note that land surface temperatures can be substantially higher than air temperatures.
The Copernicus image below shows Spain on 11 July 2023, where the Land Surface Temperature (LST), i.e. the temperature of the soil, in some areas of Extremadura (Spain) exceeded 60°C or 140°F, as measured by the Sea and Land Surface Temperature Radiometer (SLSTR) instrument, a feature of the Copernicus Sentinel-3 satellites.
How high could temperatures rise?
The image below, from NASA, shows that February 2016 was 3.24°C or 5.83°F hotter on land than 1850-1890. Note that 1850-1890 is not pre-industrial, while the 2016 peak was reached during an El Niño, which raises the question how much hotter than pre-industrial it will be at the peak of the current El Niño.
The image below says it even more poignantly: Looking at global averages over long periods is a diversion, peak temperature rise is the killer!
The above image shows that February 2016 was 3.28°C (5.904°F) hotter than 1880-1896 on land, and 3.68°C (6.624°F) hotter compared to February 1880 on land.
World temperature was at a new record high of 17.18°C or 62.92°F on July 4, 2023 (black). Both in 2022 (orange) and in 2016 (grey), the temperature reached 16.92°C or 62.46°F (on July 24, 2022 and August 13+14, 2016). The year 2016 is important, since it was a strong El Niño year and we're now again in an El Niño.
A 2023 study led by Tao Lian predicts the current El Niño to be strong. Moving from the bottom of a La Niña to the peak of a strong El Niño could make a difference of more than half a degree Celsius, as discussed in an earlier post.
Additionally, the June 2023 number of sunspots is more than twice as high as predicted, as illustrated by the image on the right, adapted from NOAA.
Furthermore, the 2022 Tonga submarine volcano eruption did add a huge amount of water vapor to the atmosphere, as discussed in an earlier post.
Alarm bells have been ringing for many years. As an example, the image below featured in a 2015 post, showing non-linear trends including a polynomial trendline (1: blue) pointing at global temperature anomalies of over 4°C by 2060.
Moreover, a polynomial trend for the Arctic (2: red) threatens to cause major feedbacks to kick in, triggering runaway global warming (3: white) that looks set to catch up with accelerated warming in the Arctic and result in global temperature anomalies of 16°C by 2052.
In the 2019 video below, Roger Hallam talks with Stephen Sackur from the BBC's HardTalk series.
Climate change danger assessment
The image below, earlier discussed here, expands risk assessment beyond its typical definition as the product of the severity of impact and probability of occurrence, by adding a third dimension: timescale, in particular imminence.
Conclusion
Imminence alone could make that the danger constituted by rising temperatures needs to be acted upon immediately, comprehensively and effectively. While questions may remain regarding probability, severity and timescale of the dangers associated with climate change, the precautionary principle should prevail and this should prompt for action, i.e. comprehensive and effective action to reduce damage and improve the situation is imperative and must be taken as soon as possible. To combat rising temperatures, transforming society is needed, along the lines of this 2022 post in combination with declaration of a climate emergency.
• A Multidataset Assessment of Climatic Drivers and Uncertainties of Recent Trends in Evaporative Demand across the Continental United States - by Christine Albano et al. (2022)
Heatwaves are increasingly hitting higher latitudes, as illustrated by the forecasts below. The background behind this is that the temperature rise caused by people's emissions is also causing changes to the jet streams.
[ click on images to enlarge ]
These changes to the Jet Stream are increasingly creating conditions for heatwaves to strike at very high latitudes, as also illustrated by the images on the right.
The first image on the right shows that surface temperatures as high as 48°C or 118.3°F are forecast in the State of Washington for June 30, 2021, at 01:00 UTC, at a latitude of 46.25°N. At the same time, even higher temperatures are forecast nearby at 1000 hPa level (temperatures as high as 119.4°C or 48.6°C).
The next two images on the right show what happened to the jet stream. One image shows instantaneous wind power density at 250 hPa, i.e. at an altitude where the jet stream circumnavigates the globe, on June 26, 2021 at 11:00 UTC. The image features two green circles. The top green circle marks a location where the jet stream is quite forceful and reaches a speed of 273 km/h or 170 mph. The bottom green circle marks the same location where the 48°C is forecast on June 30, 2021. This shows how heat has been able to move north from as early as June 26, 2021.
The next image on the right shows the situation on June 30, 2021, 04:00 UTC, illustrating how such a jet stream pattern can remain in place (blocked) for several days (in this case for more than five days). The green circle again marks the same location where the 48°C is forecast (in the top image on the right).
This illustrates how a more wavy jet stream can enable high temperatures to rise to higher latitudes, while holding a pattern in place for several days, thus pushing up temperatures over time in the area.
As said, these changes in the jet stream that are enabling hot air to rise up to high latitudes are caused by global warming. Accelerating warming in the Arctic is causing the temperature difference between the North Pole and the Equator to narrow, which in turn is making the jet stream more wavy.
The next image on the right shows that a UV index reading as high as 12 (extreme) is forecast for a location at 51.56°N in Washington for June 28, 2021, illustrating that such an extreme level of UV can occur at high latitudes, due to changes in the jet stream.
Accelerated Warming in the Arctic
As the temperature rise is accelerating due to people's emissions, it is speeding up more in the Arctic than anywhere else on Earth.
The Arctic is heating up faster than elsewhere, as numerous feedbacks and tipping points are hitting the Arctic, including:
• Albedo loss goes hand in hand with decline of the snow and ice cover. Albedo is a measure of reflectivity of the surface. Albedo is higher as more sunlight is reflected back upward and less energy is getting absorbed at the surface. Albedo decline can occur as snow and ice disappears and the underlying darker soil and rock becomes exposed. Even when the snow and ice cover remains extensive, its reflectivity can decline, due to cracks and holes in the ice, due to formation of melt ponds on top of the ice and due to changes in texture (melting snow and ice reflects less light). Calving of the ice can take place where warmer water can reach it, and such calving can increase as storms strengthen and waves get larger.
• Furthermore, albedo loss can occur as dust, soot and organic compounds that are caused by human activities get deposited on the snow and ice cover, reducing the reflectivity of the surface. Organic compounds and nutrients in meltwater pools can lead to rapid growth of algae, especially at times of high insolation.
• Latent heat loss. As sea ice gets thinner, ever less ocean heat gets consumed in the process of melting the subsurface ice, to the point where - as long as air temperatures are still low enough - there still is a thin layer of ice at the surface that will still consume some heat below the surface, but that at the same time acts as a seal, preventing heat from the Arctic Ocean to enter the atmosphere.
• Wind changes including changes to the Jet Stream can further amplify the temperature rise in the Arctic. As the temperature difference between the North Pole and the Equator narrows, the Jet Stream becomes more wavy, spreading out widely at times. The changes to the jet stream cause more extreme weather, including heatwaves, forest fires, storms, flooding, etc. This can cause more aerosols to get deposited on the snow and ice cover. Stronger wind and storms over the North Atlantic can also speed up the flow of warm water into the Arctic Ocean.
Albedo loss, latent heat loss and changes to wind patterns can dramatically amplify the temperature rise in the Arctic. The temperature of the Arctic Ocean is rising accordingly, while there are a number of developments and events that specifically speed up the temperature rise of the water of the Arctic Ocean, as discussed below.
Arctic Ocean heating up
The temperature of the water of the Arctic Ocean is rising, due to a number of events and developments:
Solstice occurred on June 21, 2021. The Arctic is now receiving huge amounts of sunlight (see image on the right, from the insolation page).
Sea surface temperatures and temperatures on land are very high in Siberia, Canada and Alaska. Strong winds can spread warm air over the Arctic Ocean.
Arctic sea ice extent is low for the time of year, but at this stage, there still is a lot of sea ice present (compared to September). The sea ice acts as a seal, preventing ocean heat from entering the atmosphere, resulting in more heat remaining in the Arctic Ocean.
[ Lena River, Siberia ]
Warm water from rivers is flowing into the Arctic Ocean, carrying further heat into the Arctic Ocean. Above image shows that on June 23, 2021, sea surface temperatures were 22.3°C or 72.2°F at a spot where water from the Lena River flows into the Arctic Ocean. The image on the right shows that at a nearby location the sea surface temperature was 20°C or 36°F higher than 1981-2011.
Warm water from the North Atlantic Ocean and the North Pacific Ocean is flowing into the Arctic Ocean and the amount of ocean heat flowing into the Arctic Ocean is rising each year.
As mentioned above, latent heat loss is contributing to the rapid temperature rise in the Arctic. The remaining sea ice acts as a buffer, consuming ocean heat from below. Sea ice is getting thinner each year, so ever less ocean heat can get consumed in the process of melting the sea ice from below.
Changes to the jet stream can also cause strong storms to dramatically speed up the amount of heat flowing into the Arctic Ocean, as discussed at the Cold freshwater lid on North Atlantic page.
The danger of the temperature rise of the Arctic Ocean
The danger of the temperature rise of the Arctic Ocean is that it can cause destabilization of hydrates at its seafloor, resulting in eruption of huge amounts of methane from hydrates and from free gas underneath the hydrates.
[ The Buffer has gone, feedback #14 on the Feedbacks page ]
In conclusion, changes to the jet stream could cause a huge temperature rise soon, while a 3°C rise could cause humans to go extinct, which is a daunting prospect. Even so, the right thing to do is to help avoid the worst things from happening, through comprehensive and effective action as described in the Climate Plan.