Heatwaves
High Wet Bulb Globe Temperature (WBGT) is forecast to hit the Southeastern United States over the next few days. The image below shows a forecast for June 29, 2023, 18 UTC with WBGT as high as 34°C (93°F) forecast for a location near Jackson, Mississippi, U.S.
 |
| [ click on images to enlarge ] |
WBGT is a measure used by weather.gov to warn about expected heat stress when in direct sunlight. It estimates the effect of temperature, relative humidity, wind speed, and solar radiation on humans using a combination of temperatures from three thermometers:
- A Wet bulb measures the temperature read by a thermometer covered in a wet cloth. As water evaporates from the cloth, evaporation cools the thermometer. This mirrors how the human body cools itself with sweat.
- A black globe is used to measure solar radiation. Solar radiation heats the globe and wind blowing across it cools the globe.
- A Dry bulb calculates the air temperature measured in the shade. It is the temperature you would see on your thermometer outside.

The images on the right earlier featured in a 2016 post.
The top image, an animation from the EPA, illustrates that a relatively small rise in average temperature can have a huge impact and result in a lot more hot weather as well as in even more extreme hot weather.
 |
| [ from earlier post ] |
The three images underneath, from the IPCC, show the effect on extreme temperatures when (a) the mean temperature increases, (b) the variance increases, and (c) when both the mean and variance increase for a normal distribution of temperature.
The thermodynamic wet-bulb temperature is determined by temperature, humidity and pressure (hPa), and it is the lowest temperature that can be achieved by evaporative cooling of a water-wetted ventilated surface.
As temperatures and humidity levels keep rising, there comes a point where the wind factor no longer matters, in the sense that wind can no longer provide cooling.
The human body can cool itself by sweating, which has a physiological limit that was long described as a 35°C wet-bulb temperature. Once the wet-bulb temperature reaches 35°C, one can no longer lose heat by perspiration, even in strong wind, but instead one will start gaining heat from the air beyond a wet-bulb temperature of 35°C.
Accordingly, a 35°C wet-bulb temperature (equal to 95°F at 100% humidity or 115°F at 50% humidity) was long seen as the theoretical limit, the maximum a human could endure.
A 2020 study (by Raymond et al.) warns that this limit could be regularly exceeded with a temperature rise of less than 2.5°C (compared to pre-industrial). A 2018 study (by Strona & Bradshaw) indicates that most life on Earth will disappear with a 5°C rise. Humans, who depend for their survival on many other species, will likely go extinct with a 3°C rise, as illustrated by the image below, from an earlier post.

A 2022 study (by Vecellio et al.) finds that the actual limit is lower — about 31°C wet-bulb or 87°F at 100% humidity — even for young, healthy subjects. The temperature for older populations, who are more vulnerable to heat, is likely even lower. In practice the limit will typically be lower and depending on circumstances could be as low as a wet-bulb temperature of 25°C.
The images below show high readings on the 'Misery Index', the perceived temperature that is used by nullschool.net, combining wind chill and the heat index (which in turn combines air temperature and relative humidity, in shaded areas).
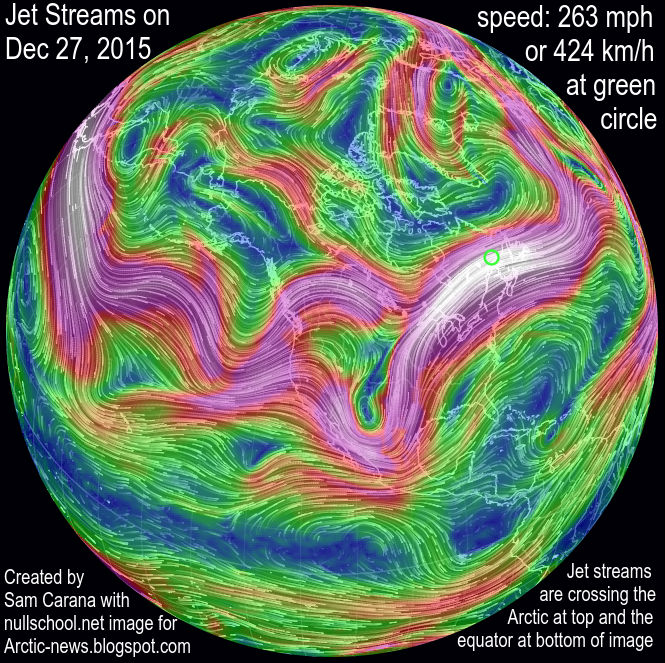
The image below shows a forecast for June 29, 2023 20 UTC, with weather conditions prolonged by circular wind patterns at 250 hPa (Jet Stream), while the Jet Stream is crossing the Equator (bottom left). Temperatures as high as 39.9°C (103.7°F) combined with a relative humidity of 35% result in perceived temperatures as high as 45°C (112.9°F) at the green circle.
The image below shows a forecast for June 29, 2023 20 UTC, with weather conditions prolonged by circular wind patterns at 250 hPa (Jet Stream), while the Jet Stream is crossing the Equator (bottom left). Temperatures as high as 39.9°C (103.7°F) combined with a relative humidity of 35% result in perceived temperatures as high as 45°C (112.9°F) at the green circle.

As it turned out, the perceived temperature was as high as 44.9°C or 112.7°F on June 29, 2023 19 UTC, due to a 39.1°C or 102.5°F temperature and a 38% relative humidity at the surface, and with conditions prolonged by a distorted Jet Stream (at 250 hPa), with circular wind patterns and winds crossing the Equator.

The image below shows high readings on the 'Misery Index' for parts of Pakistan. On June 22, 2023, an air temperature of 45.4°C (113.7°F) and a relative humidity of 25% resulted in a perceived temperature of 51°C (123.7°F) at the area marked by the green circle.

The above image also shows the Jet Stream (wind at 250 hPa). Distortion of the Jet Stream can lead to circular wind patterns that amplify heatwaves. As temperature rise, the temperature difference between the Equator and the Arctic narrows, distorting the Jet Stream resulting in more extreme weather.
Perceived (feels like) air temperatures as high as 53.1°C or 127.7°F were recorded in Pakistan on July 4, 2023, 09 UTC (at green circle), with a 46.7°C or 116.1°F temperature and a 24% relative humidity recorded at the surface. Also, Jet Stream deformation shows up (at 250 hPa), with circular wind patterns and wind crossing the Equator (at the image bottom).

Meanwhile, heatwave conditions have also been affecting China, Texas and Mexico recently, with all-time high temperature records broken in each of these places.
The press release of a 2022 Unicef report has the title 559 million children currently exposed to high heatwave frequency, rising to all 2.02 billion children globally by 2050.
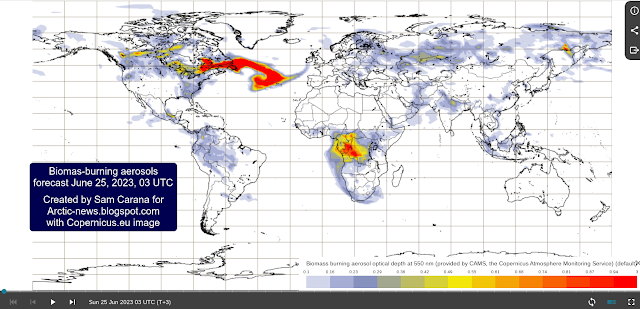
Fire and smoke from fires
An additional hazard is fire and the smoke from fires. The image below shows biomass-burning aerosols from fires in Canada extending over the North Atlantic on June 25, 2023, 03 UTC.
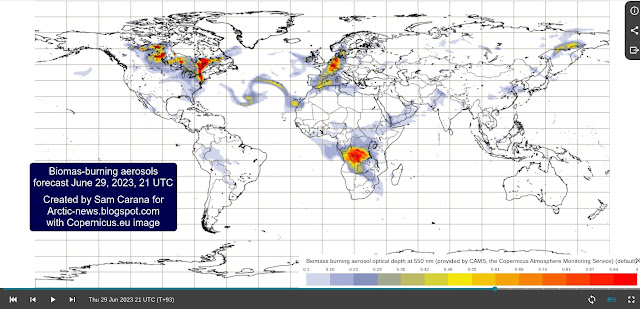
The forecast for June 29, 2023 21 UTC below shows remnants of the Canadian forest fires reaching Western Europe.
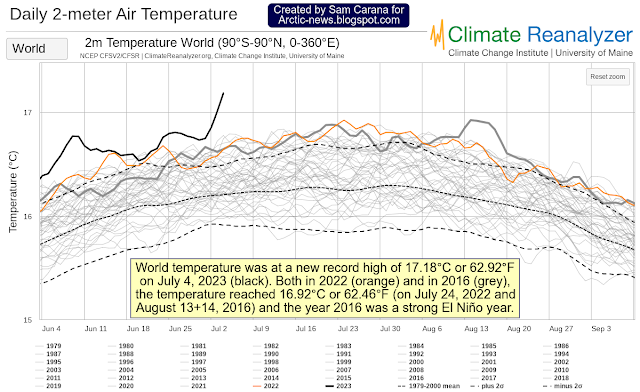
World temperature was at a new record high of 17.18°C or 62.92°F on July 4, 2023 (black). Both in 2022 (orange) and in 2016 (grey), the temperature reached 16.92°C or 62.46°F (on July 24, 2022 and August 13+14, 2016). The year 2016 is important, since it was a strong El Niño year and we're now again in an El Niño.
 A 2023 study led by Tao Lian predicts the current El Niño to be strong. Moving from the bottom of a La Niña to the peak of a strong El Niño could make a difference of more than half a degree Celsius, as discussed in an earlier post.

Imminence alone could make that the danger constituted by rising temperatures needs to be acted upon immediately, comprehensively and effectively. While questions may remain regarding probability, severity and timescale of the dangers associated with climate change, the precautionary principle should prevail and this should prompt for action, i.e. comprehensive and effective action to reduce damage and improve the situation is imperative and must be taken as soon as possible. To combat rising temperatures, transforming society is needed, along the lines of this 2022 post in combination with declaration of a climate emergency.
Accordingly, everyone is encouraged to support and share this Climate Emergency Declaration.
Links
• Wet Bulb Globe Temperature
https://digital.mdl.nws.noaa.gov
• National Weather Service - Wet Bulb Globe Temperature: How and when to use it
https://www.weather.gov/news/211009-WBGT
• Nullschool.net
https://earth.nullschool.net
• Weather tracker: China issues heatstroke alert amid historic heatwave
https://www.theguardian.com/environment/2023/jun/23/weather-tracker-china-issues-heatstroke-alert-amid-historic-heatwave
• Peaks matter
https://arctic-news.blogspot.com/2018/08/peaks-matter.html
• It could be unbearably hot in many places within a few years time
https://arctic-news.blogspot.com/2016/07/it-could-be-unbearably-hot-in-many-places-within-a-few-years-time.html
• The emergence of heat and humidity too severe for human tolerance - by Colin Raymons et al. (2020)
https://www.science.org/doi/10.1126/sciadv.aaw1838
• Brief periods of dangerous humid heat arrive decades early
• Co-extinctions annihilate planetary life during extreme environmental change, by Giovanni Strona and Corey Bradshaw (2018)
https://www.nature.com/articles/s41598-018-35068-1
• Jet Stream
https://arctic-news.blogspot.com/p/jet-stream.html
• When Will We Die?
https://arctic-news.blogspot.com/2019/06/when-will-we-die.html

The forecast for June 29, 2023 21 UTC below shows remnants of the Canadian forest fires reaching Western Europe.

Feedbacks
As temperatures rise, fire and smoke hazards increase due to self-reinforcing feedback loops, including:
The image on the right, from a news release associated with a 2022 study, shows changes in atmospheric thirst, measured in terms of reference evapotranspiration from 1980-202 (in mm).
As temperatures rise due to people's emissions, more evaporation will take place over both land and oceans, but not all water will return as precipitation, so more water vapor will stay in the air and droughts affecting the soil and vegetation will intensify.
Water in the soil acts as a buffer, slowing down the temperature rise, so drier soil will heat up faster and further, causing land surface temperatures to rise even more and amplifying the impact of Urban heat island and Heat dome phenomena.
The image on the right, adapted from ESA, shows land surface temperatures as high as 65°C (149°F) in India on April 26, 2022. Note that land surface temperatures can be substantially higher than air temperatures.
How high could temperatures rise?
Albedo loss and Jet Stream distortion: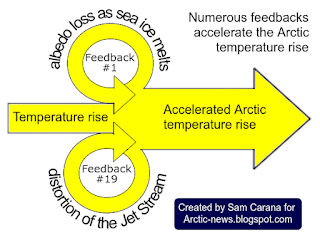
[ Two out of numerous feedbacks ]
- as sea ice melts away and gets covered by meltpools and rainwater pools, soot, dust, and algae, the resulting albedo loss further pushes up temperatures
- the narrowing temperature difference between the Arctic and the Tropics causes Jet Stream distortion, resulting in more extreme weather, incl. stronger storms that come with more lightning and can carry more oxygen to fires and spread fires faster and wider, and more intense heatwaves that can dramatically push up local temperatures, further intensifying droughts and forest fires- a further self-reinforcing feedback loop is that water that was previously present in the soil, is increasingly moving up into the atmosphere, as the atmosphere sucks up more water vapor (7% more water vapor for every 1°C in temperature rise ), resulting in:
- less evapotranspiration from vegetation, in turn resulting in less clouds and rain, thus pushing up temperatures and drying out soil and vegetation even more
- erosion and less healthy vegetation that is more vulnerable to pests and diseases such as bark beetles, resulting in an increase in dead trees providing more fuel for fires

 |
| [ from earlier post ] |
As temperatures rise due to people's emissions, more evaporation will take place over both land and oceans, but not all water will return as precipitation, so more water vapor will stay in the air and droughts affecting the soil and vegetation will intensify.
 |
| [ from earlier post ] |
The image on the right, adapted from ESA, shows land surface temperatures as high as 65°C (149°F) in India on April 26, 2022. Note that land surface temperatures can be substantially higher than air temperatures.
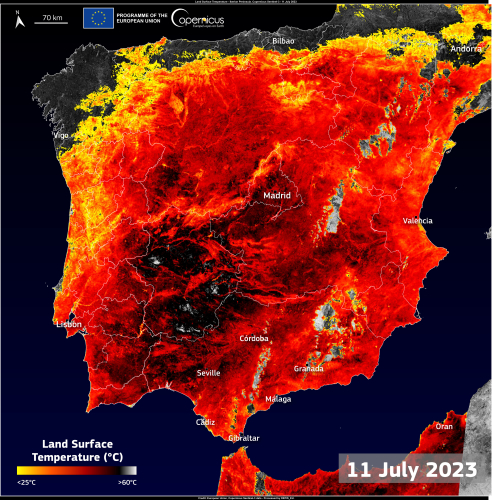
The Copernicus image below shows Spain on 11 July 2023, where the Land Surface Temperature (LST), i.e. the temperature of the soil, in some areas of Extremadura (Spain) exceeded 60°C or 140°F, as measured by the Sea and Land Surface Temperature Radiometer (SLSTR) instrument, a feature of the Copernicus Sentinel-3 satellites.

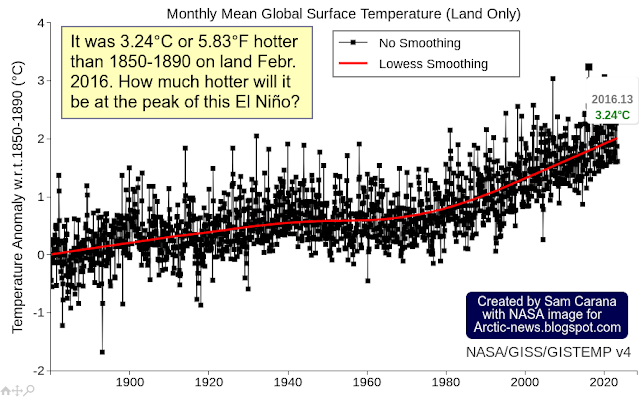
The image below, from NASA, shows that February 2016 was 3.24°C or 5.83°F hotter on land than 1850-1890. Note that 1850-1890 is not pre-industrial, while the 2016 peak was reached during an El Niño, which raises the question how much hotter than pre-industrial it will be at the peak of the current El Niño.

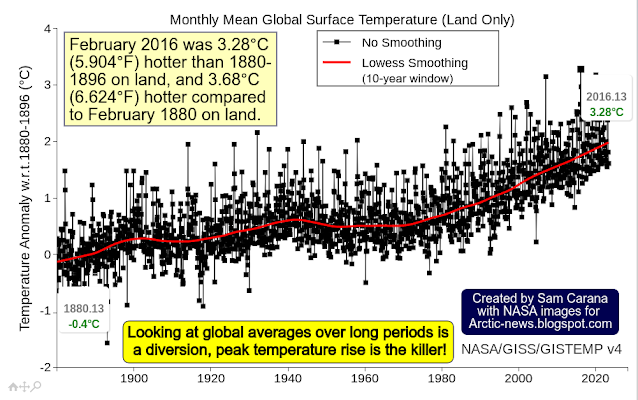
The image below says it even more poignantly: Looking at global averages over long periods is a diversion, peak temperature rise is the killer!

The above image shows that February 2016 was 3.28°C (5.904°F) hotter than 1880-1896 on land, and 3.68°C (6.624°F) hotter compared to February 1880 on land.

World temperature was at a new record high of 17.18°C or 62.92°F on July 4, 2023 (black). Both in 2022 (orange) and in 2016 (grey), the temperature reached 16.92°C or 62.46°F (on July 24, 2022 and August 13+14, 2016). The year 2016 is important, since it was a strong El Niño year and we're now again in an El Niño.

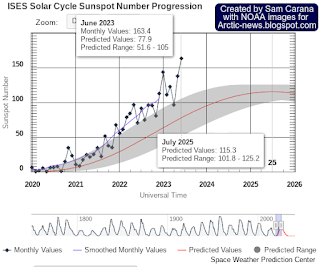
Additionally, the June 2023 number of sunspots is more than twice as high as predicted, as illustrated by the image on the right, adapted from NOAA.
Furthermore, the 2022 Tonga submarine volcano eruption did add a huge amount of water vapor to the atmosphere, as discussed in an earlier post.
Alarm bells have been ringing for many years. As an example, the image below featured in a 2015 post, showing non-linear trends including a polynomial trendline (1: blue) pointing at global temperature anomalies of over 4°C by 2060.
Moreover, a polynomial trend for the Arctic (2: red) threatens to cause major feedbacks to kick in, triggering runaway global warming (3: white) that looks set to catch up with accelerated warming in the Arctic and result in global temperature anomalies of 16°C by 2052.
 |
| [ from a 2015 post, click on image to enlarge ] |
In the 2019 video below, Roger Hallam talks with Stephen Sackur from the BBC's HardTalk series.
Climate change danger assessment
The image below, earlier discussed here, expands risk assessment beyond its typical definition as the product of the severity of impact and probability of occurrence, by adding a third dimension: timescale, in particular imminence.
The image below, earlier discussed here, expands risk assessment beyond its typical definition as the product of the severity of impact and probability of occurrence, by adding a third dimension: timescale, in particular imminence.
Conclusion
Imminence alone could make that the danger constituted by rising temperatures needs to be acted upon immediately, comprehensively and effectively. While questions may remain regarding probability, severity and timescale of the dangers associated with climate change, the precautionary principle should prevail and this should prompt for action, i.e. comprehensive and effective action to reduce damage and improve the situation is imperative and must be taken as soon as possible. To combat rising temperatures, transforming society is needed, along the lines of this 2022 post in combination with declaration of a climate emergency.
 |
| [ image from Climate Emergency Declaration ] |
Links
• Wet Bulb Globe Temperature
https://digital.mdl.nws.noaa.gov
• National Weather Service - Wet Bulb Globe Temperature: How and when to use it
https://www.weather.gov/news/211009-WBGT
• Nullschool.net
https://earth.nullschool.net
• Weather tracker: China issues heatstroke alert amid historic heatwave
https://www.theguardian.com/environment/2023/jun/23/weather-tracker-china-issues-heatstroke-alert-amid-historic-heatwave
• Peaks matter
https://arctic-news.blogspot.com/2018/08/peaks-matter.html
• It could be unbearably hot in many places within a few years time
https://arctic-news.blogspot.com/2016/07/it-could-be-unbearably-hot-in-many-places-within-a-few-years-time.html
• The emergence of heat and humidity too severe for human tolerance - by Colin Raymons et al. (2020)
https://www.science.org/doi/10.1126/sciadv.aaw1838
• Brief periods of dangerous humid heat arrive decades early
• Evaluating the 35°C wet-bulb temperature adaptability threshold for young, healthy subjects (PSU HEAT Project) - by Daniel Vecellio et al. (2022)
https://journals.physiology.org/doi/full/10.1152/japplphysiol.00738.2021
Discussed at: https://www.facebook.com/groups/arcticnews/posts/10159973158374679
Discussed at: https://www.facebook.com/groups/arcticnews/posts/10159973158374679
• Co-extinctions annihilate planetary life during extreme environmental change, by Giovanni Strona and Corey Bradshaw (2018)
https://www.nature.com/articles/s41598-018-35068-1
• Jet Stream
https://arctic-news.blogspot.com/p/jet-stream.html
• When Will We Die?
https://arctic-news.blogspot.com/2019/06/when-will-we-die.html
• Copernicus - Biomass-burning aerosols
https://atmosphere.copernicus.eu/charts/packages/cams/products/aerosol-forecasts
• Extinction
https://arctic-news.blogspot.com/p/extinction.html
• Will there be Arctic sea ice left in September 2023?
https://arctic-news.blogspot.com/2023/05/will-there-be-arctic-sea-ice-left-in-september-2023.html
• Clausius–Clapeyron relation
https://en.wikipedia.org/wiki/Clausius–Clapeyron_relation
• Urban heat island
https://en.wikipedia.org/wiki/Urban_heat_island
• Heat dome
https://en.wikipedia.org/wiki/Heat_dome
• ESA - Heatwave across India
https://www.esa.int/ESA_Multimedia/Images/2022/04/Heatwave_across_India
• Evaporative Demand Increase Across Lower 48 Means Less Water Supplies, Drier Vegetation, and Higher Fire Risk
https://www.drought.gov/news/evaporative-demand-increase-across-lower-48-means-less-water-supplies
• A Multidataset Assessment of Climatic Drivers and Uncertainties of Recent Trends in Evaporative Demand across the Continental United States - by Christine Albano et al. (2022)
https://journals.ametsoc.org/view/journals/hydr/23/4/JHM-D-21-0163.1.xml
• Carbon dioxide crosses 422 ppm
• Carbon dioxide crosses 422 ppm
https://arctic-news.blogspot.com/2022/04/carbon-dioxide-crosses-422-ppm.html
• 559 million children currently exposed to high heatwave frequency, rising to all 2.02 billion children globally by 2050
• 559 million children currently exposed to high heatwave frequency, rising to all 2.02 billion children globally by 2050
https://www.unicef.org/press-releases/heatwaves-report
• Copernicus - Scorching heatwave hits Spain
https://www.copernicus.eu/en/media/image-day-gallery/scorching-heatwave-hits-spain
• NASA - custom plots
https://data.giss.nasa.gov/gistemp/graphs_v4/customize.html
• Climate Reanalyzer - World Daily 2-meter Air Temperature (90-90°N, 0-360°E)
https://climatereanalyzer.org/clim/t2_daily
• NOAA - Solar cycle sunspot number progression
https://www.swpc.noaa.gov/products/solar-cycle-progression
• A Strong 2023/24 El Niño is Staged by Tropical Pacific Ocean Heat Content Buildup - by Tao Lian et al. (2023)
https://spj.science.org/doi/10.34133/olar.0011
• Transforming Society
https://arctic-news.blogspot.com/2022/10/transforming-society.html
• Climate Plan
https://arctic-news.blogspot.com/p/climateplan.html
• Climate Emergency Declaration
https://arctic-news.blogspot.com/p/climate-emergency-declaration.html
• Transforming Society
https://arctic-news.blogspot.com/2022/10/transforming-society.html
• Climate Plan
https://arctic-news.blogspot.com/p/climateplan.html
• Climate Emergency Declaration
https://arctic-news.blogspot.com/p/climate-emergency-declaration.html


